Sail through any server emergency like a boss
See the full picture of what’s going on in your databases, services, and processes. Benefit from thousands of automatically collected server metrics.

Why Odarix?

Easy, straightforward UI
We focus on being simple: even first-timers can start and get to the bottom really quickly.

Advanced PostgreSQL monitoring
With our comprehensive insights, you will troubleshoot any DB-related issues effortlessly.

Based in the EU
We are GDPR-compliant; all your data is only stored in EU data centres.
Stay updated whenever something fails
Find out what's happening
Figure out what to do
Have it all fixed in no time

Comprehensive insights
Odarix auto-magically collects hundreds and even thousands of metrics for each subsystem. Get all visualizations in one place
Focus on your business, not your monitoring
Get the monitoring that “just works” with ready-to-use, helpful charts, dashboards, and alerts. No more maintaining and customizing it. No more distractions from your core tasks

Relevant metrics out of the box
Vast experience and mistakes have allowed us to pick the right metrics that make it clear what has failed and what to do.

Smart monitoring
It’s not just about the right metrics: Odarix is also well versed in various failure scenarios. Your servers and services are continuously monitored for them.

Auto-configuration
Odarix discovers all services and processes and collects all metrics automatically. No manual configuration is required.

Microservices monitoring
You can see both the state of your cluster as a whole as well as the behavior of each specific server, container, and process. This renders localizing issues a breeze, even in complex infrastructures.
Monitoring that provides answers
No more digging through server logs. Identify problems right on the graphs
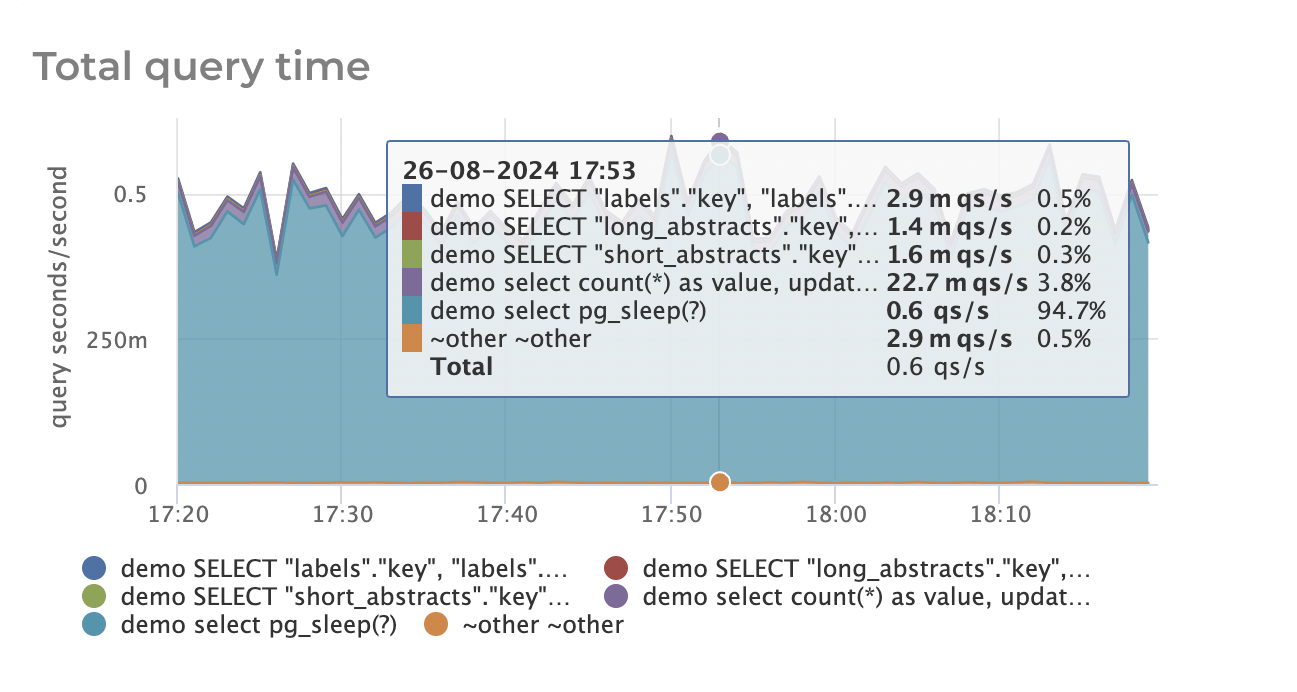
A clear view on PostgreSQL
The database is the heart of a project's infrastructure. Database issues lead to service downtime and financial losses. With Odarix, you always have a clear picture of what's happening in Postgres.
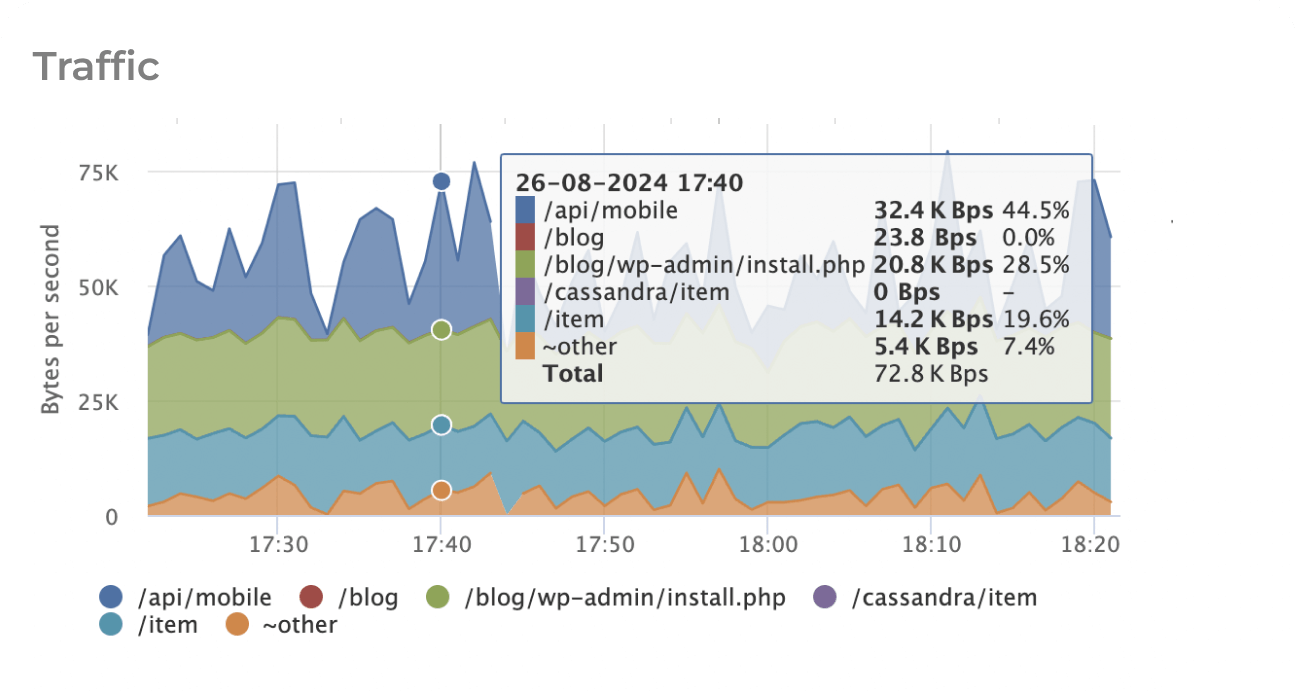
Nginx
Keep track of every user’s web request thanks to the access.log monitoring. Pinpoint slow backend responses, unreliable pages, and faulty servers.
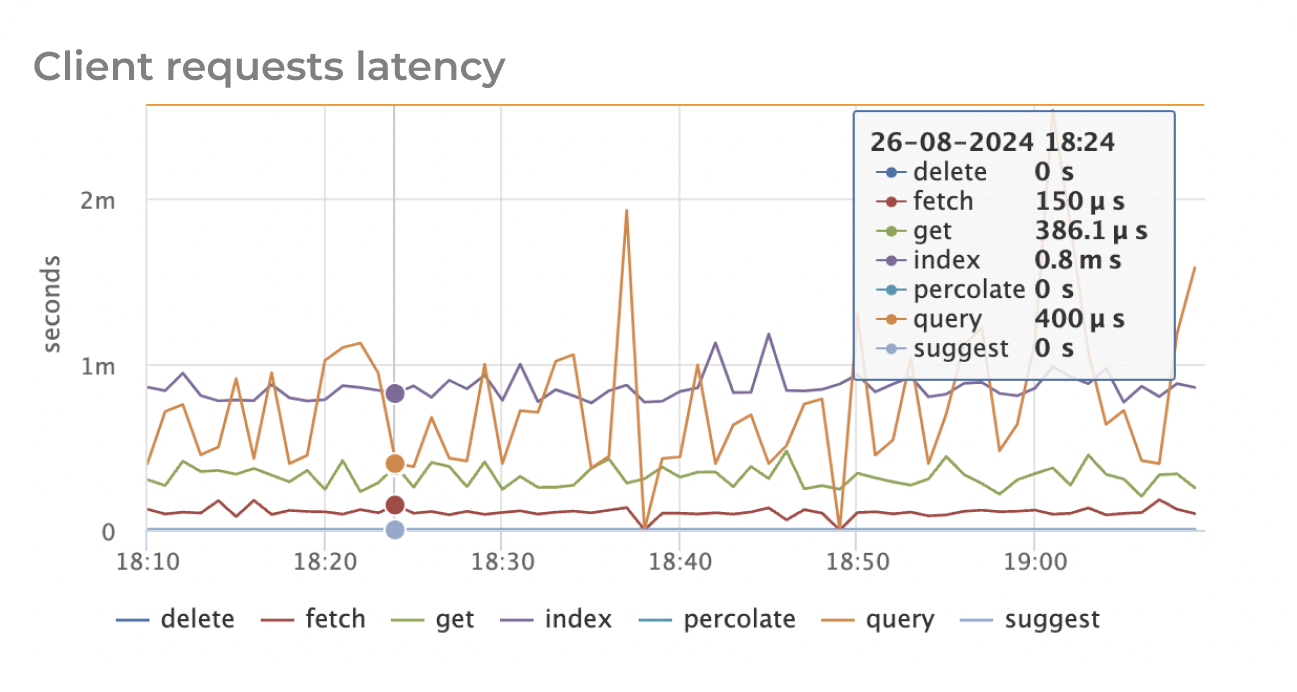
Extensive server monitoring
Keep an eye on everything: disks, network, TCP/IP stack, and hardware. You are always aware if RAID is slowing down or CPU is overheating.
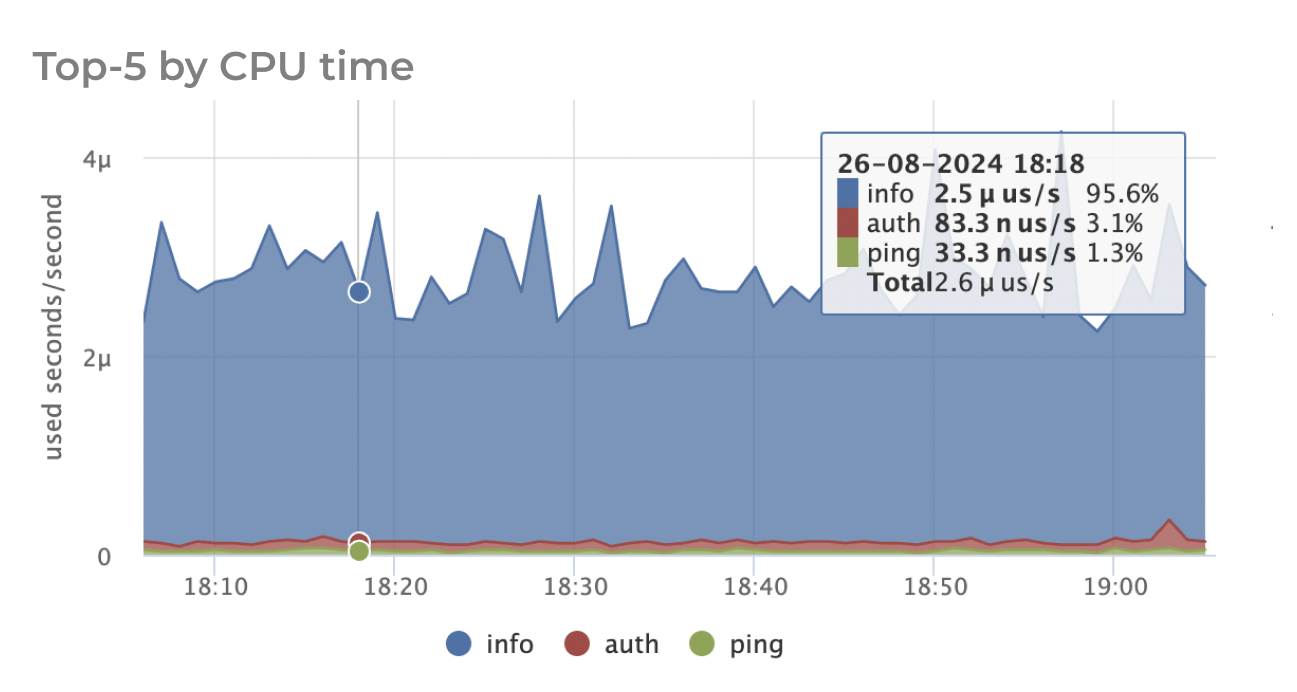
Detailed process monitoring
Easily detect when processes are misbehaving. Odarix keeps track of CPU, memory, disk space, and swap usage by each system process.
How it works
Install odarix agent on your servers
Odarix agent will detect every process running on a server and auto-configure all the required plugins.
Metrics are collected, processed and sent to Odarix
Preset, revealing dashboards for each service will appear in two minutes.
Everything is under control now!
Every minute, Odarix checks your infrastructure and notifies whenever something’s wrong.
Pricing
Pricing information. All listed prices are net prices and are subject to applicable VAT where applicable.
FAQ

We have a lot of servers, with virtualization and/or containers, how is it billed?
Odarix agent is installed on physical as well as virtual servers. It will collect the data on everything happening on and with the server with no regard if it's virtual or not. That's why each server with agent installed will be billed as full unit. Containers are monitored from the host server, so it won't increase the bill. If you happen to have more than a hundred of servers — contact us, to discuss the price.

We run on AWS EC2 with Auto Scaling and stuff. Will it work?
In order for odarix agent to play nicely with Auto Scale, you should install it into the image or setup agent installation in startup/cloud-init scripts. Odarix billing works by 95% burstable method, i.e. for each month 5% of the time with the maximum number of hosts is ignored. We understand that it might be not very suitable in some cases and we're commited to do something better with it. Meanwhile, please, contact us, to discuss possible solutions.

We're not allowed to use a SaaS (due to regulation etc). What can be done?
For restricted enviroments Odarix might be shipped as a managed on-prem installation. I.e. you provide us with servers (or AWS sub account). Odarix team deploys and manages a private Odarix server just for you. All your monitoring data won't leave your premises. Contact us, if you need to sign an NDA or discuss this further.

